Step 1: Make it
What is it?
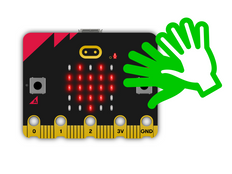
Measure how noisy it is around you using the new micro:bit's microphone sensor and a simple bar chart display.
Introduction
Coding guide
What you'll learn
- How to use the new micro:bit's built-in microphone input sensor to measure how loud sounds are around you
- How to display numerical data from input sensors graphically on the LED display output
How it works
- The new micro:bit's microphone measures sound levels in numbers between 0 and 255. 0 is the quietest and 255 is the loudest sound measurement it can make.
- The code uses a forever loop to keep the microphone measuring sound levels and plotting a bar graph on the LED display.
- The louder the sounds measured, the higher the bar graph gets.
What you need
- new micro:bit with sound (or MakeCode simulator)
- MakeCode or Python editor
- battery pack (optional)
Step 2: Code it
1from microbit import *
2
3# function to map any range of numbers to another range
4def map(value, fromMin, fromMax, toMin, toMax):
5    fromRange = fromMax - fromMin
6    toRange = toMax - toMin
7    valueScaled = float(value - fromMin) / float(fromRange)
8    return toMin + (valueScaled * toRange)
9
10# set of images for simple bar chart
11graph5 = Image("99999:"
12               "99999:"
13               "99999:"
14               "99999:"
15               "99999")
16
17graph4 = Image("00000:"
18               "99999:"
19               "99999:"
20               "99999:"
21               "99999")
22
23graph3 = Image("00000:"
24               "00000:"
25               "99999:"
26               "99999:"
27               "99999")
28
29graph2 = Image("00000:"
30               "00000:"
31               "00000:"
32               "99999:"
33               "99999")
34
35graph1 = Image("00000:"
36               "00000:"
37               "00000:"
38               "00000:"
39               "99999")
40
41graph0 = Image("00000:"
42               "00000:"
43               "00000:"
44               "00000:"
45               "00000")
46
47allGraphs = [graph0, graph1, graph2, graph3, graph4, graph5]
48
49# ignore first sound level reading
50soundLevel = microphone.sound_level()
51sleep(200)
52
53while True:
54    # map sound levels from range 0-255 to range 0-5 for choosing graph image
55    soundLevel = int(map(microphone.sound_level(), 0, 255, 0, 5))
56    display.show(allGraphs[soundLevel])
57 Step 3: Improve it
- Create your own ways of displaying how loud a sound is, for example showing different emojis depending on how loud it is
- Make a visual noise alarm that only flashes when the sound goes over a certain level - you could use this to help keep your classroom peaceful