Exploring science through data with the BBC micro:bit
Discover how our new data literacy collections are helping students investigate scientific questions, make sense of their results and explain their findings.
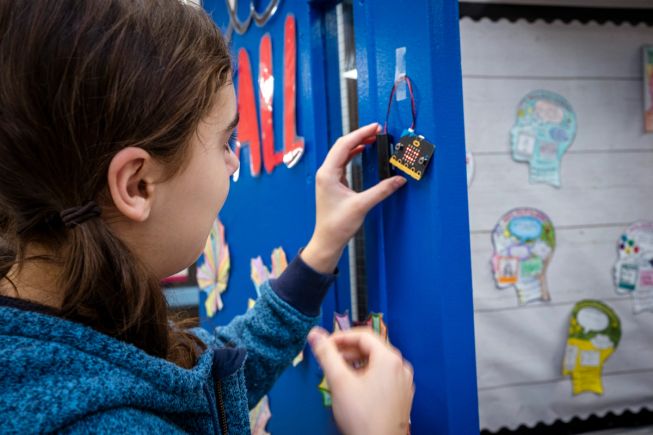
Students can use the micro:bit to measure light or sound levels as part of a science investigation.
Which materials keep heat in? How do conditions change around your school? Where would you put a solar panel?
For World Science Day, we’re exploring how data literacy helps young people find answers through scientific investigation. Learning to gather, interpret and question data also helps them understand the world around them.
As Gareth Stockdale, CEO of the Micro Educational Foundation, explains in his article Helping young people shape their AI future:

Data literacy enables learners to gather, visualise, interpret and communicate data, turning information into insight that can build understanding of the world.


Why data literacy matters in science
Data literacy is the ability to gather, visualise, interpret, and communicate data as information, and understand the role of data in making decisions that impact society and the environment. It is fundamental to science, areas of mathematics, and AI literacy.
Taking a reading is just the beginning. Did students keep the other testing conditions consistent? What patterns can they see? What might explain an unexpected result, and would taking more readings help? Discussing these questions encourages students to think critically about evidence. Comparing findings with classmates and explaining differences are important parts of a scientific investigation.
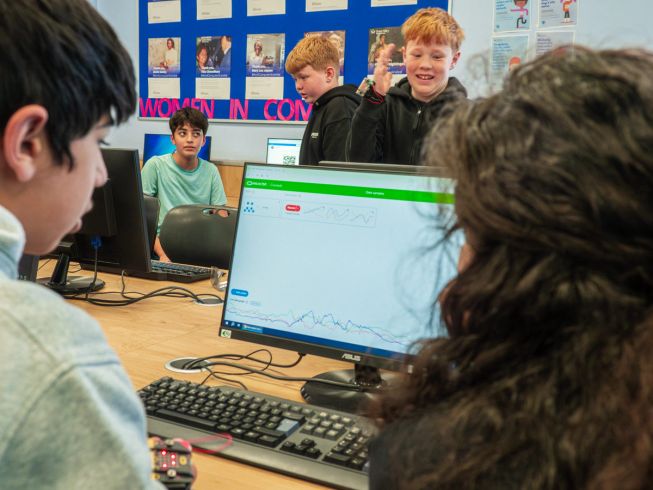
In micro:bit CreateAI, students can see how a movement like waving their hand becomes data they can read on a graph.
Using the micro:bit enables opportunities to experience first-hand how data collected by computer sensors becomes digital data. Collecting readings from familiar surroundings, such as light levels or temperatures around their school, gives students a personal connection to their investigations and helps them make sense of their results. They can explore how this data becomes information, they can use to solve problems, make decisions and recommend changes.
New collections to support your teaching
Our new data literacy collections bring together projects, lessons and professional development, helping you find activities suited to your students:
- Data literacy for younger students aged 7–12 includes counting species, exploring environmental conditions and investigating light and sound.
- Data literacy for older students aged 11–16 includes environmental data logging, investigations into materials and activities exploring energy use.
Investigations to try with your students
Explore the natural world:
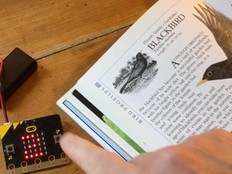
Count different species of plants and animals.
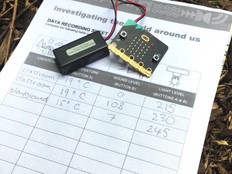
Measure temperature, sound and light levels around you
With the Species counter, students press the micro:bit’s buttons to count two types of plants or animals they spot. Environment exploration lets them compare temperature, light and sound readings in different places. Both offer opportunities to discuss how the location, time or number of observations might affect their findings.
Investigate changes over time:
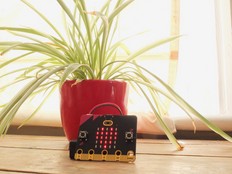
Record and study data about the world around you
Discover evaporation rates in different locations.
Use the Environment data logger to record and study changing conditions, or explore evaporation rates in different locations with the Evaporation experiment. Students can consider how often to collect data and how to present their results so patterns are easier to see.
Test the properties of materials:
Investigate materials to see how much light they let through
Investigate the thermal insulation properties of materials.
Investigate how much light different materials let through with the Light experiment, or explore thermal insulation with the Insulating heat experiment. Encourage students to make fair comparisons and use their measurements to explain differences.
Use evidence to make decisions:
Decide where to put a solar panel with your micro:bit.
Time how long your lights are on
The Solar panel experiment challenges students to investigate a suitable location for a solar panel. With the Energy light timer, they can measure how long lights are left on and use their findings to suggest ways to save energy.
Support for your classroom
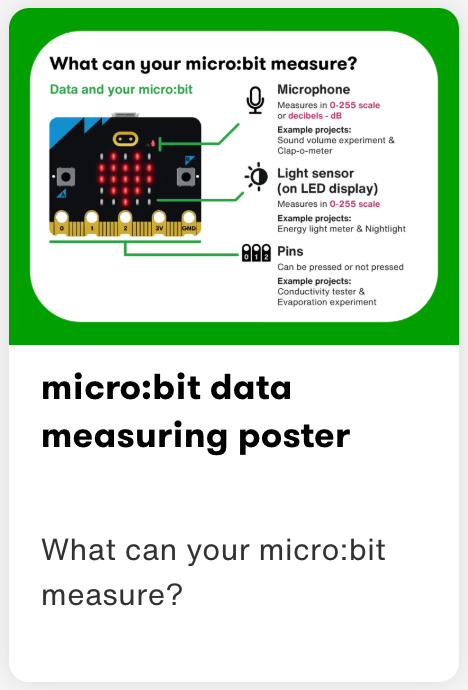
Our micro:bit data measuring poster helps students familiarise themselves with the sensors and their units of measure. Display it in your classroom or use it when planning an investigation.
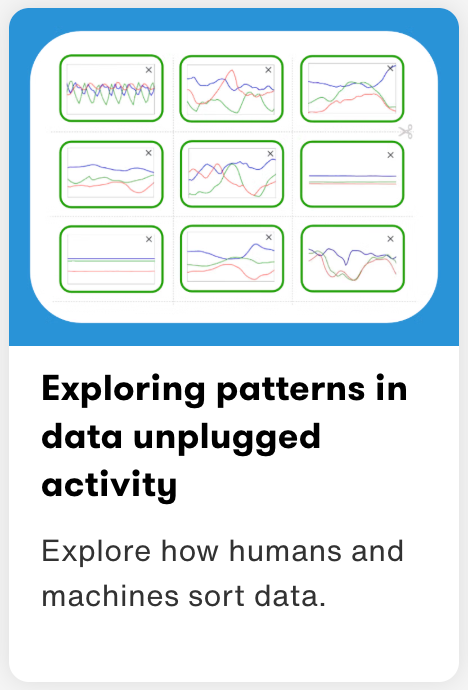
For additional practice recognising patterns, try the Exploring patterns in data unplugged activity. This short activity builds on students’ understanding of data presented in graphs to explore how humans and machines sort it.
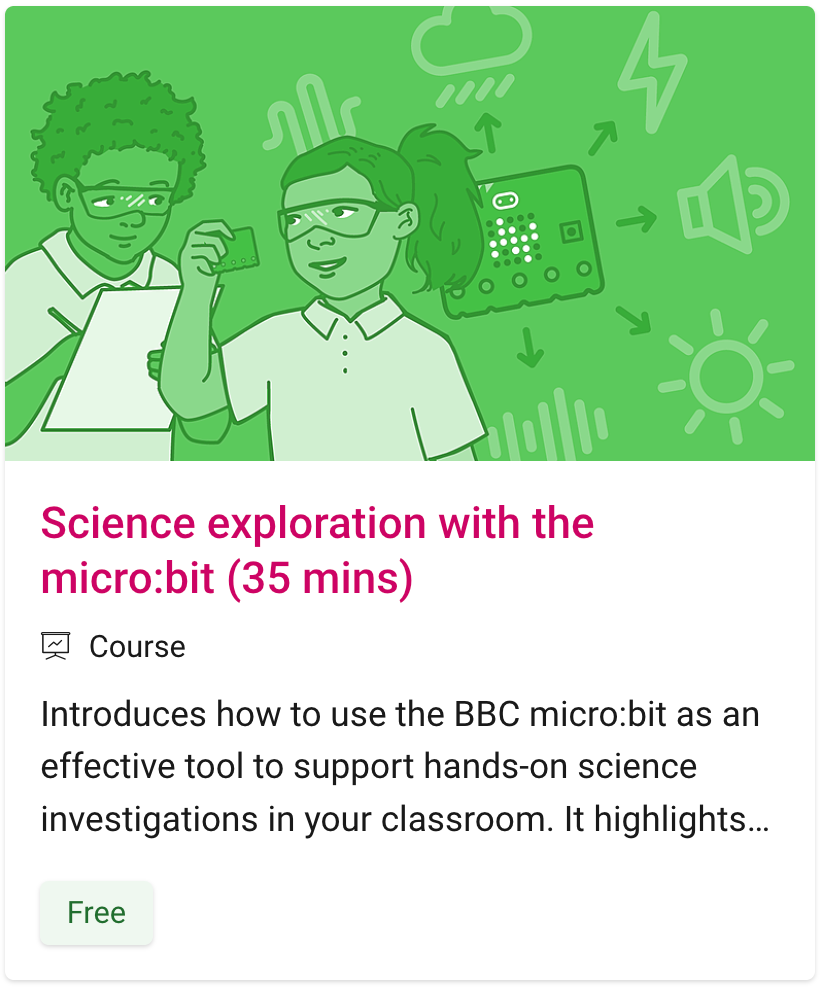
Looking for guidance on teaching science with the micro:bit? Our free Science exploration with the micro:bit professional development course covers collecting and using science data through four practical investigations. It includes classroom materials for exploring the environment, conductivity, sound insulation and data logging.
Beyond the science lesson
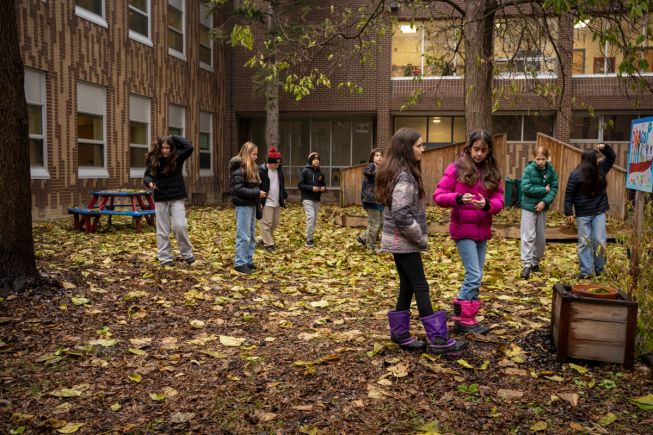
Taking science outdoors gives students a chance to collect data with the micro:bit and compare readings from different parts of the school grounds.
Students can apply these data literacy skills in other subjects too: interpreting graphs in mathematics, comparing movement data in physical education or questioning the data used to train AI. They also help young people question claims and make informed decisions in everyday life.
Planning investigations, spotting patterns and explaining conclusions also develops critical thinking, problem-solving and the confidence to support ideas with evidence. These skills matter throughout life. Asking “Where did this data come from?” and “Does it support the claim being made?” helps young people assess information and make informed decisions.
Whether students are finding out which materials keep heat in or where to put a solar panel, data literacy helps them explain how they know, as well as what they have discovered. This World Science Day, our new collections offer practical ways to develop that understanding through investigations in your classroom.