Корак 1: Уради
Шта је ово?
Use data logging with your BBC micro:bit V2 to gather accelerometer readings to help design a personalised fitness tracker.
Увод
Водич за програмирање
Шта вам је потребно
- a micro:bit V2
- a computer and micro USB cable for coding the micro:bit and viewing your data
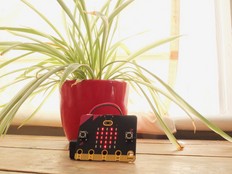
- micro:bit battery pack
- our data logging guide may be useful
Gather data
- Transfer the code below to your micro:bit, then disconnect it from your computer.
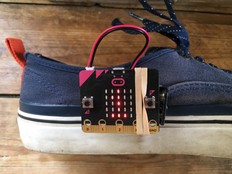
- Connect a battery pack and attach the micro:bit to your shoe or leg.
- Previous data is deleted when you transfer new code to your micro:bit, but you can also delete old data by pressing buttons A and B together.
- Press button A to start logging data. A tick appears on the display. It is now recording accelerometer data ten times every second.
- Start walking and count how many steps you take - try ten to start with.
- In the very unlikely event the micro:bit log becomes full, all the lights on the LED display will light up.
- Press button B to stop logging. You should see an X appear to show it’s stopped.
Analyse your data
- Disconnect the battery pack and plug the micro:bit into a computer.
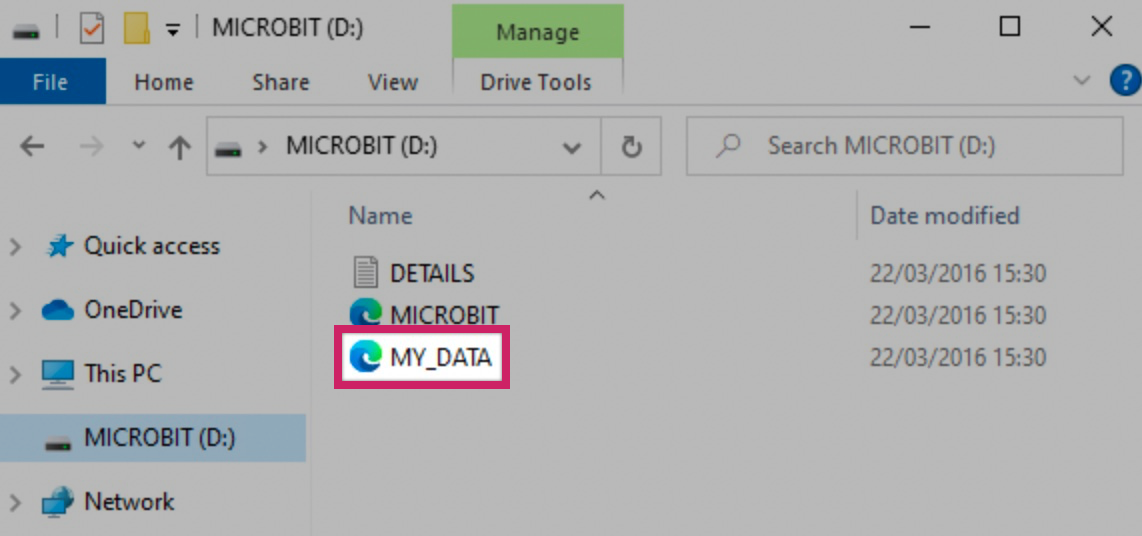
- The micro:bit appears like a USB drive called MICROBIT. Look in there and open the MY_DATA file to see a table of your data and a visual preview in your web browser:
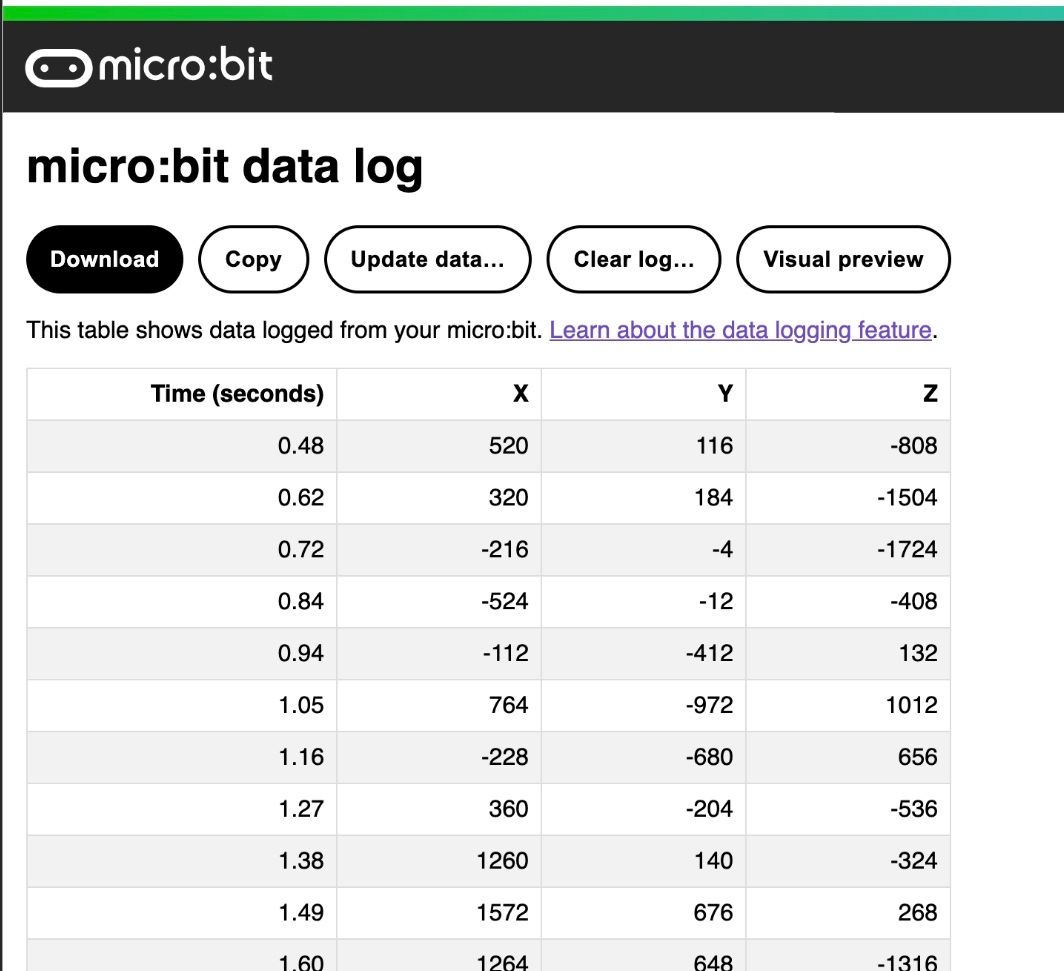
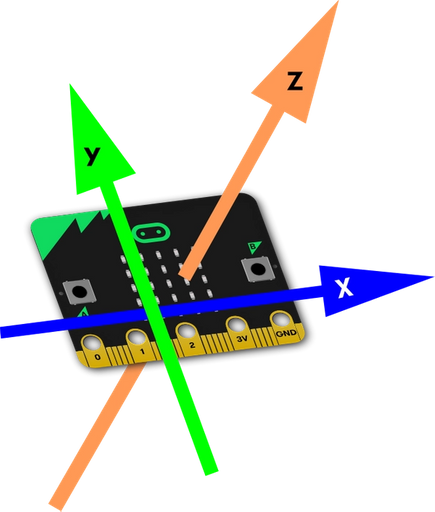
- Data from the accelerometer has been recorded in three dimensions:
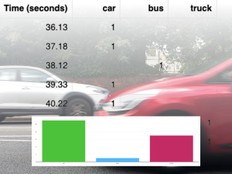
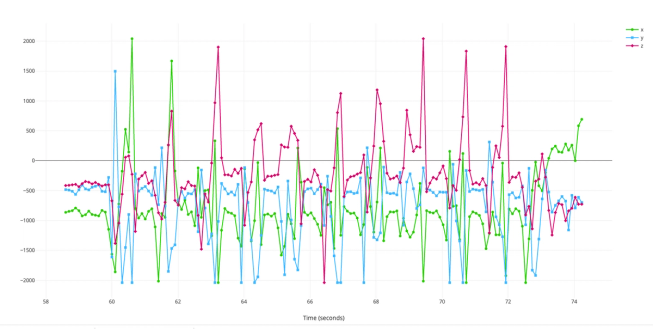
- Click on visual preview to see the data as a graph. Examine it and see if you can spot where the user took ten steps:
Use your data
Studying this data you can see that almost every time a step was taken, the reading in the Z axis went above 500.
So with this data set, we might use the number 500 as the threshold to use in the Sensitive step counter project, modifying the 'acceleration (mg) strength' block to read 'acceleration (mg) z > 500'.
This means that you've collected data that's unique to the way you walk, and used it to make a personalised digital product that works better for you.
Корак 2: Програмирај
Корак 3: Унапреди
- You could use the movement data logger to compare different parachutes and how they affect the acceleration of a micro:bit as it falls.
- Copy and paste the data into a spreadsheet to analyse it in different ways, for example using statistical tools.
- Use a spreadsheet to visualise the data in other ways and make a presentation about your project.