1단계: 만들어 보세요.
프로젝트 소개
BBC micro:bit V2 로 데이터 로깅을 사용하면 가속도계 판독값을 수집하여 개인화된 피트니스 추적기를 설계하는 데 도움이 됩니다.
소개
프로그래밍 가이드
준비물
- 아 micro:bit V2
- micro:bit 를 코딩하고 데이터를 보기 위한 컴퓨터와 마이크로 USB 케이블
- micro:bit 배터리 팩
- 저희의 데이터 로깅 가이드가 유용할 수 있습니다
데이터 수집
- 아래 코드를 micro:bit 로 옮긴 후 컴퓨터에서 분리하세요.
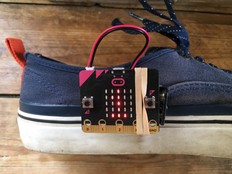
- 배터리 팩을 연결하고 micro:bit 를 신발이나 다리에 부착하세요.
- 새로운 코드를 micro:bit 로 전송하면 이전 데이터는 삭제되지만, A 버튼과 B 버튼을 동시에 눌러서 이전 데이터를 삭제할 수도 있습니다.
- 버튼 A를 눌러 데이터 로깅을 시작하세요. 디스플레이에 체크표시가 나타납니다. 지금은 매초 10번씩 가속도계 데이터를 기록하고 있습니다.
- 걷기를 시작하고 몇 걸음을 걸었는지 세어보세요. 처음에는 10걸음부터 시작해 보세요.
- 매우 낮은 확률로 micro:bit 로그가 가득 차면 LED 디스플레이의 모든 표시등이 켜집니다.
- 로깅을 중지하려면 버튼 B를 누르세요. 중지되었다는 것을 나타내는 X가 나타나야 합니다.
데이터 분석
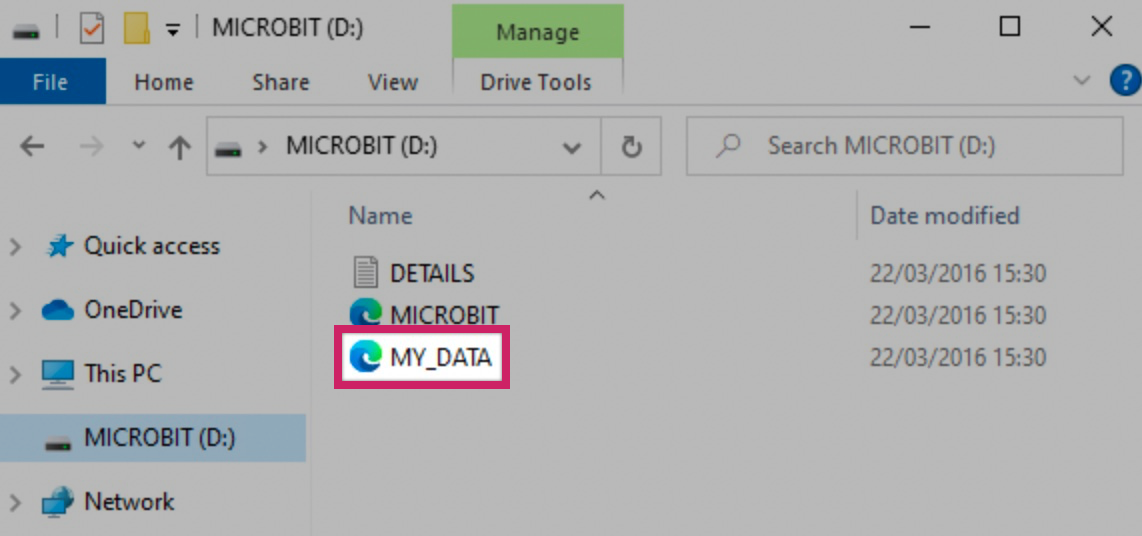
- 배터리 팩을 분리하고 micro:bit 를 컴퓨터에 연결합니다.
- micro:bit 는 MICROBIT이라는 USB 드라이브처럼 보입니다. 거기에서 MY_DATA 파일을 열어 데이터 표와 웹 브라우저에서 시각적 미리 보기를 확인하세요.
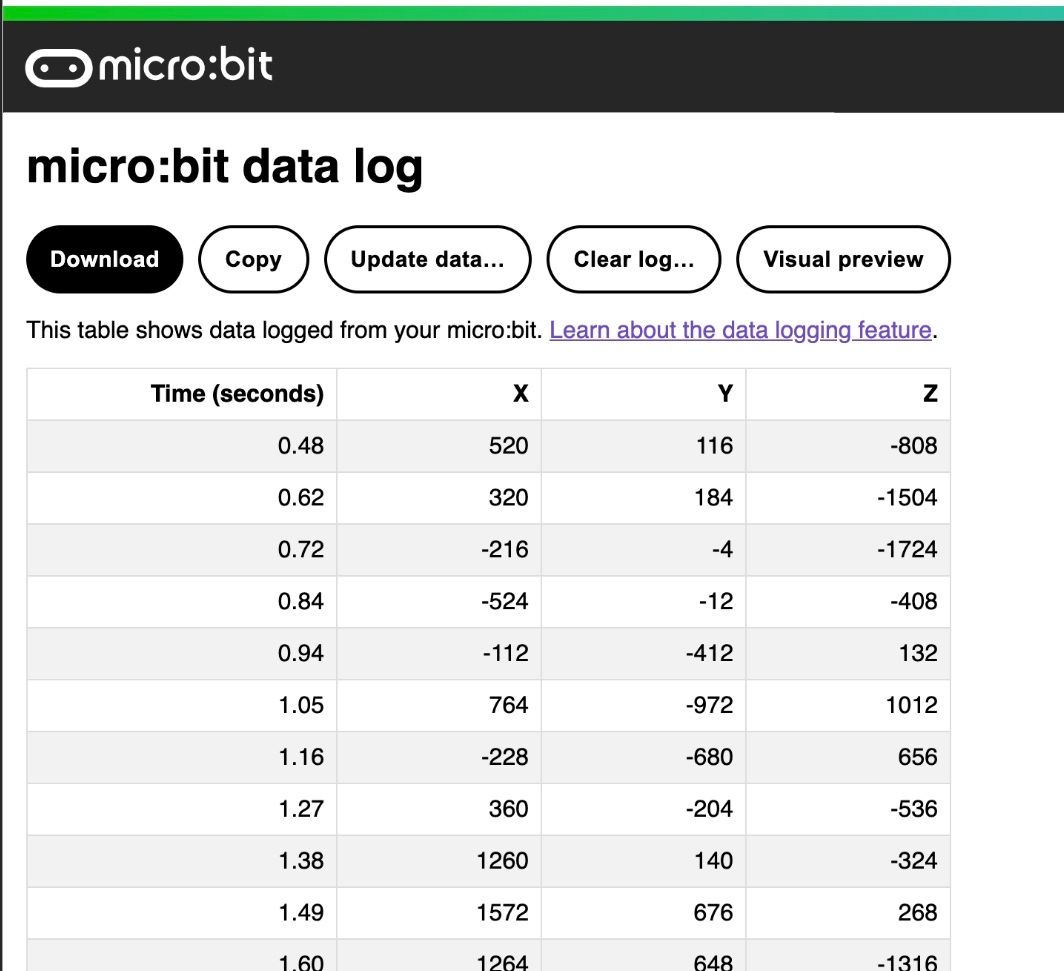
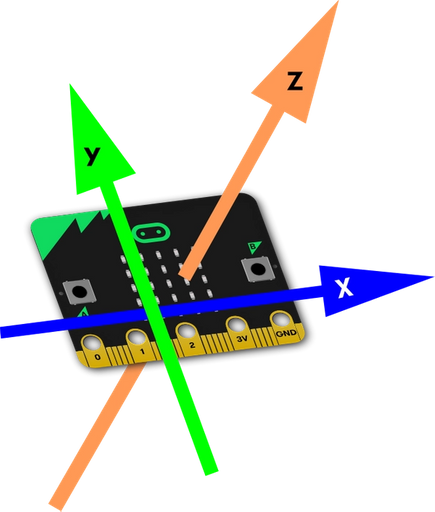
- 가속도 센서로부터 받은 데이터가 3D로 저장되었습니다.
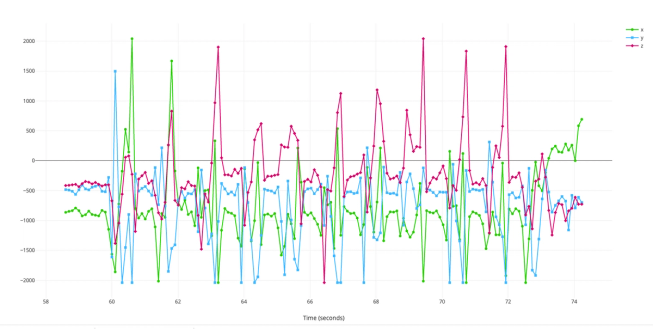
- 시각적 미리보기를 클릭하면데이터를 그래프로 볼 수 있습니다. 이를 조사하여 사용자가 10걸음 이동한 곳을 찾아보세요.
데이터를 사용하세요
이 데이터를 살펴보면 거의 매번 한 걸음을 내딛을 때마다 Z축의 판독값이 500 을 넘어선 것을 알 수 있습니다.
따라서 이 데이터 세트를 사용하면 민감한 걸음 수 측정기 프로젝트에서 임계값으로 500 을 사용할 수 있으며, '가속도(mg) 강도' 블록을 '가속도(mg) z > 500 '으로 수정합니다.
즉, 개인의 걷는 방식에 따른 고유한 데이터를 수집하여 이를 바탕으로 개인에게 더 적합한 디지털 제품을 만드는 것입니다.
2단계: 프로그래밍 해보세요.
3단계: 더 좋게 만들어 보세요.
- 운동 데이터 로거를 사용하면 다양한 낙하산을 비교하고 micro:bit 가 떨어질 때의 가속도에 어떤 영향을 미치는지 알아볼 수 있습니다.
- 다양한 방법(예: 통계 도구 사용)으로 데이터를 분석하기 위해 스프레드시트에 데이터를 복사하여 붙여넣습니다.
- 스프레드시트를 사용하여 다른 방법으로 데이터를 시각화하고 프로젝트에 대한 프레젠테이션을 만드세요.