Step 1: Make it
What is it?
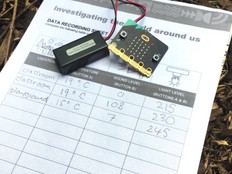
Discover the best places to grow plants by using your BBC micro:bit to study light levels and temperatures over several hours or days.
Introduction
Coding guide
What you need
- a micro:bit V2
- a computer and micro USB cable for coding the micro:bit and viewing your data
- micro:bit battery pack (optional but recommended)
- our data logging guide may be useful
Gather data
- Flash the program below onto your micro:bit.
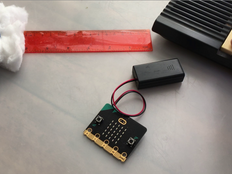
- Disconnect it from your computer, attach a battery pack and put the micro:bit where you'd like to study temperature and light levels.
- Transferring a new program to your micro:bit will erase any previous data logs, but you can also delete old data by pressing buttons A and B together. Having one set of data with continuous timestamps makes it easier to view later.
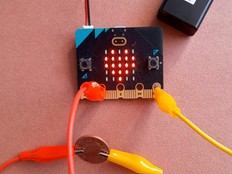
- Press button A to start logging. A tick (or check mark) will appear on the LED display. It will now record data every 1 minute (60,000 milliseconds). You can change this interval by modifying the 'every' block in the code. A heart flashes on the LED display to show when data is being recorded.
- In the unlikely event the log becomes full, the code lets you know by lighting all the LEDs on the display.
- Press button B to stop logging. You'll see an 'X' appear to show it has stopped.
Analyse your data
- Disconnect the battery pack and plug the micro:bit back into a computer. The micro:bit appears like a USB drive called MICROBIT. Look in the MICROBIT drive and open the MY_DATA file to see a table of your data in a web browser:
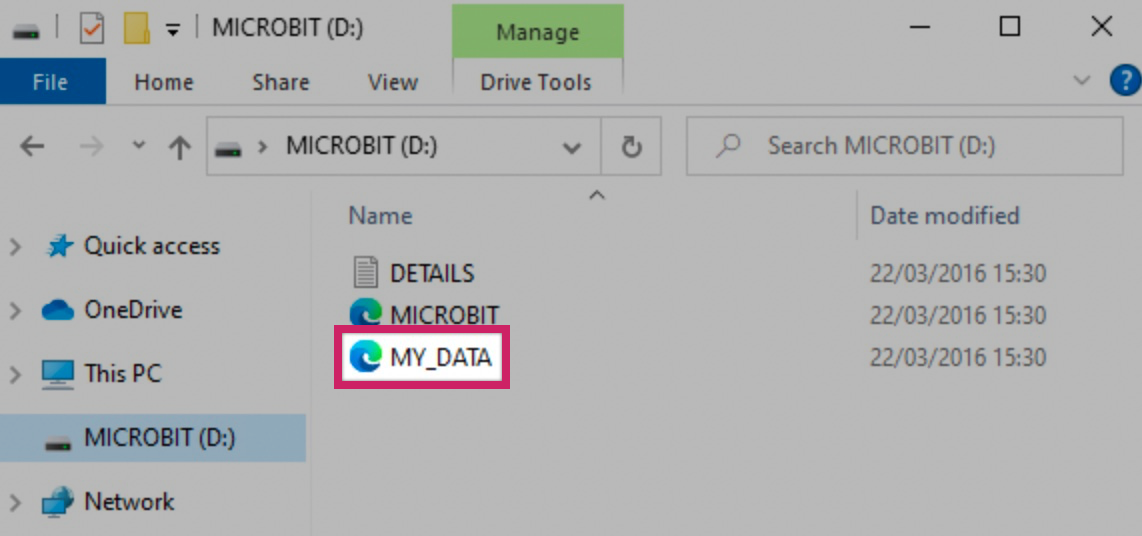
How to find your data on the MICROBIT drive
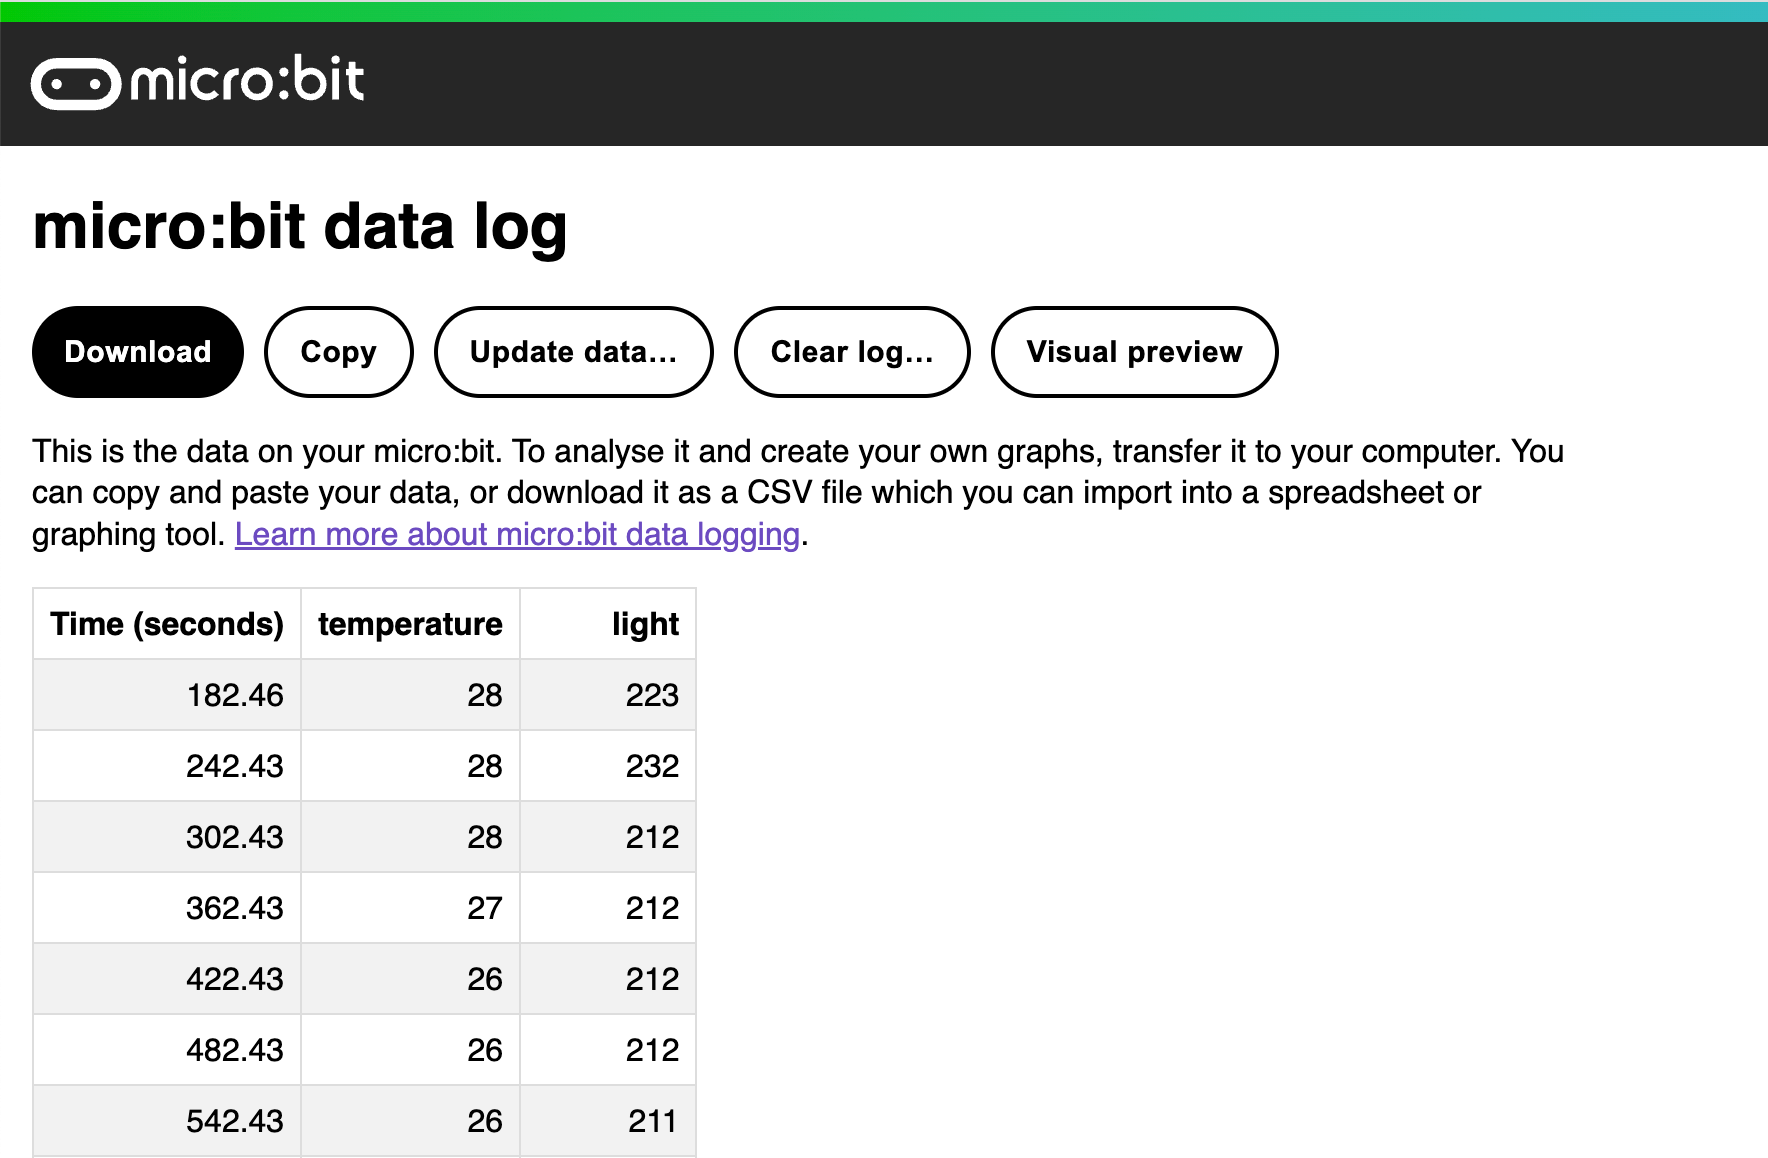
Your data appears in a table in a web browser
- The time stamps in the log represent the amount of time that has passed since your micro:bit was powered on. If you log more than one set of data without clearing the log, you may not be able to see the visual preview of the data you want to study, so it’s a good idea to delete the previously stored log before starting a new experiment.
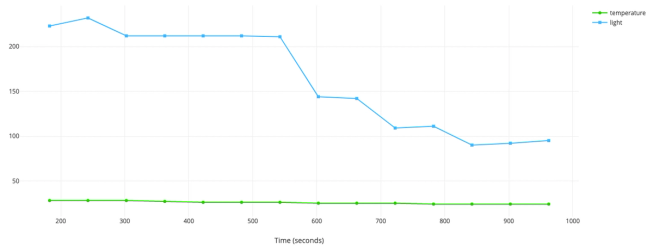
- Click on Visual preview to see a graph of your data:
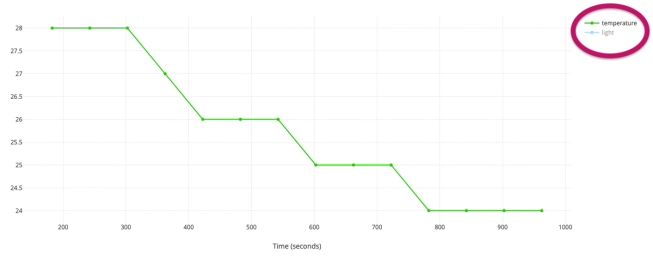
- You can isolate individual lines by clicking on their labels. Light readings may vary between 0 and 255, but temperatures are likely to vary in a smaller range. Here we can see changes in temperature more clearly by viewing its line on its own:
- You can also click on the Copy button and then paste your data into a spreadsheet.
Step 2: Code it
Step 3: Improve it
- Record data over a longer period of time, such as once an hour for several days.
- Run the experiment in different places and compare your data.
- Create a report based on your findings to help people make decisions about where plants will grow best.
- You could user this project to study patterns of electric light and heating use and use the data to suggest ways of saving energy.
- Modify the code to study noise levels over time using the microphone.