Stap 1: Voorbereiden
Wat is het?
Gebruik je BBC micro:bit om te bepalen waar een zonnepaneel geplaatst kan worden door het licht aan verschillende kanten van een gebouw te meten.
Dit project is voor natuurkundeleraren, samen met White Rose Science. Leerlingen gebruiken een datalogger, onderzoeken resultaten en leren over hernieuwbare energie.
Leerlingen kunnen ook werken met variabelen, verschillende vormen van input en output in een computerprogramma.
Deze video legt uit hoe je het experiment moet doen.
Zo werkt het
- Je hebt vier micro:bits nodig, met daarop het zonlichtdata logger hex bestand.
- Elke micro:bit wordt gekoppeld aan een batterijpakket en geplaatst in een gesloten plastic zak.
- Hang een zak op aan elke kant van het gebouw (noord, zuid, oost en west), of aan zoveel kanten waar je bij kunt.
- Je logt informatie in over lichtniveaus op alle vier de micro:bits gedurende 24 uur.
- Download en vergelijk de gegevens om de beste plaatsing voor een zonnepaneel te bepalen.
Benodigdheden
- micro:bits
- doorzichtige plastic zakken
- batterijpakketten met nieuwe batterijen erin
- tekenreeks
- een computer/laptop/tablet en een USB-kabel om de gegevens te bekijken
Stap 2: Onderzoek
- Download zonlichtdata logger hex bestand en zet het op je micro:bits. Je hoeft de code voor dit project zelf niet te schrijven om het experiment te doen. Als je geïnteresseerd bent in coderen, bezoek dan de stap 4: Codeer het gedeelte hieronder.
- Sluit de batterijen aan en doe elke micro:bit in een afgesloten plastic zak tegen het nat worden.
- Markeer elke plastic zak om de locatie ervan te bepalen bij het analyseren van de gegevens.
- Bevestig de zakken aan de zijkanten van het gebouw en zorg dat er geen schaduw op valt.
- Druk op knop A op elke micro:bit en start met het verzamelen van gegevens. Wanneer je begint met loggen, verschijnt er een vinkje op de micro:bit’s LED-scherm gedurende twee seconden. Daarna licht één LED in de linkerbovenhoek van het scherm op, nu is de micro:bit gegevens aan het verzamelen. Er verschijnt ook één keer per uur een hart op het display wanneer gegevens worden vastgelegd.
- Wacht 24 uur en druk dan op B op elke micro:bit om te stoppen. Er verschijnt een kruis op elke micro:bit's LED-scherm.
Tips
- Zet elke micro:bit een beetje schuin tegen de muur (45°) en leg er een steentje bij zodat hij niet verschuift. Zo worden je metingen nog beter.
- Als je het experiment opnieuw moet uitvoeren, verwijder de data door op knoppen A en B te drukken. Er zal een schedel verschijnen op het LED-scherm. Druk op de reset knop op de achterkant van de micro:bit om de tijd terug te zetten naar 0.
Stap 3: Analyseren
Om de gegevens te bekijken, moet je het batterijpakket loskoppelen en de micro:bit weer aansluiten op een computer. De micro:bit verschijnt als een USB schijf genaamd MICROBIT. Kijk in het MICROBIT station en open het MIJN_DATA bestand om een tabel met je gegevens in een webbrowser te zien:
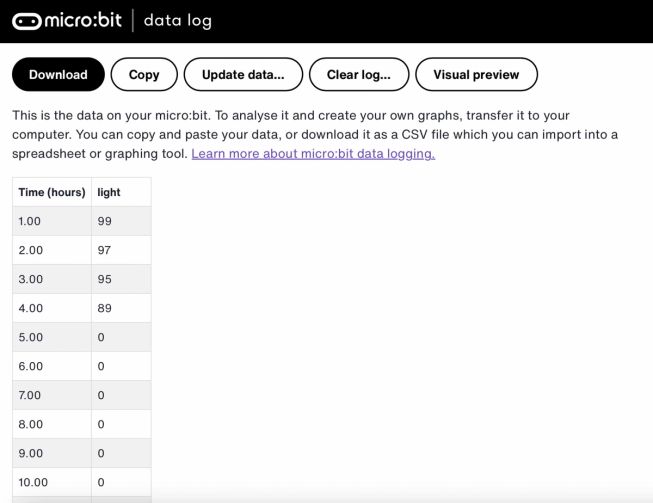
- De tijdstempels in de log geven aan hoeveel tijd er is verstreken sinds de gegevensregistratie is begonnen.
- Klik op Visuele weergave om een grafiek van je gegevens te zien:
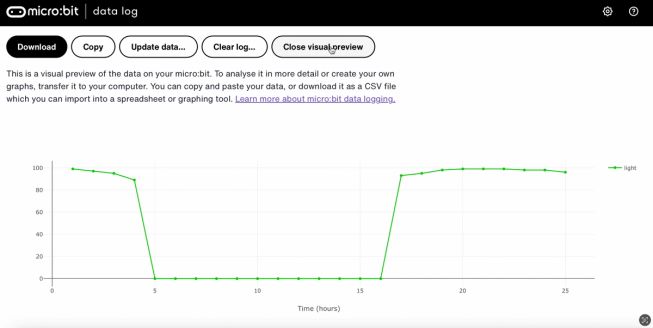
Je kunt op Kopieer klikken en vervolgens je gegevens in een spreadsheet plakken. Als je al je gegevens verzamelt in één spreadsheet, is het makkelijker om informatie aan de verschillende zijden van het gebouw te vergelijken.
Step 4: Codeer het
Bekijk deze video om te zien hoe je het project kunt coderen:
Als je geïnteresseerd bent in het wijzigen van de code voor dit project, klik dan op de knoppen hieronder: