Pas 1: Preparació
En què consisteix?
Utililitzeu la vostra micro:bit de la BBC per decidir on posar un panell solar mesurant la llum en diferents costats d'un edifici.
Aquest projecte es desenvolupa conjuntament amb White Rose Science per a professorat de ciències i permet a l'alumnat utilitzar el data logger, reportar i presentar troballes d'enquestes i aprendre més sobre fonts d'energies renovables. L'alumnat pot treballar amb variables i diverses formes d'entrada i sortida de dades en un programa informàtic.
Aquest vídeo explica com fer l'experiment.
Com funciona
- Necessitareu quatre micro:bits, cadascuna amb el fitxer de data logger de llum solar carregat.
- Cadascuna de les micro:bit està connectada a un paquet de piles i posada dins d'una bossa de plàstic estanca.
- Una bossa es posa al nord, una al sud, una a l'est i una altra a l'oest d'un edifici o al màxim de cares possibles.
- El registre de la informació sobre nivells de llum en les micro:bits durant 24 hores.
- Descarregueu i compareu les dades per descobrir el millor lloc per posar un panell solar.
Què necessites
- micro:bits
- bosses de plàstic transparents
- paquets de piles amb piles noves
- cadena
- un ordinador/portàtil/tauleta amb un cable USB per veure les vostres dades
Pas 2: Investigueu
- Descarregueu l'arxiu hex de les dades de llum i poseu-lo a les vostres micro:bits. No necessiteu escriue el codi d'aquest projecte per fer l'experiment. Si us interessa codificar-lo, visiteu el Pas 4: a la secció de Codificació de més avall.
- Attach your battery packs and put each micro:bit into a sealed plastic bag to prevent them from getting wet.
- Mark each plastic bag so you can identify its location when analysing the data.
- Fix your bags to the sides of your building, ensuring there is nothing casting a shadow over the bags.
- Press button A on each micro:bit to start data logging. When you start logging, a tick appears on the micro:bit’s LED display for two seconds. Following that, one LED lights up in the top-left corner of the display to show you that the micro:bit is in logging mode. A heart also appears on the display once per hour when data is being logged.
- Return after 24 hours and press button B on each micro:bit to stop logging. A cross appears on each micro:bit’s LED display.
Tips
- To be more accurate, angle each micro:bit at 45 degrees from a wall, using a small stone as a weight to keep it in place.
- If you need to conduct the experiment again, delete the data by pressing buttons A and B together. A skull will appear on the LED display. Press the reset button on the back of the micro:bit to set the time back to 0.
Step 3: Analyse
To look at the data logged, disconnect the battery pack and plug the micro:bit into a computer. La micro:bit es mostra com una unitat USB amb el nom de MICROBIT. Mira a la unitat MICROBIT, obre l'arxiu MY_DATA i veuràs les teves dades en una taula al navegador web.
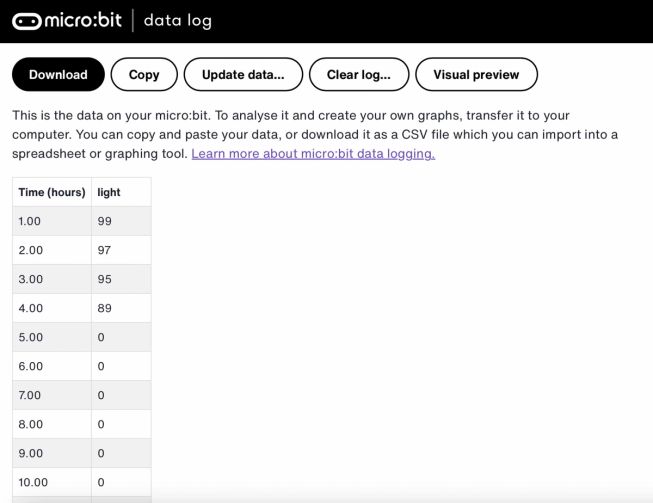
- The time stamps in the log represent the amount of time that has passed since data logging began.
- Click on Visual preview to see a graph of your data:
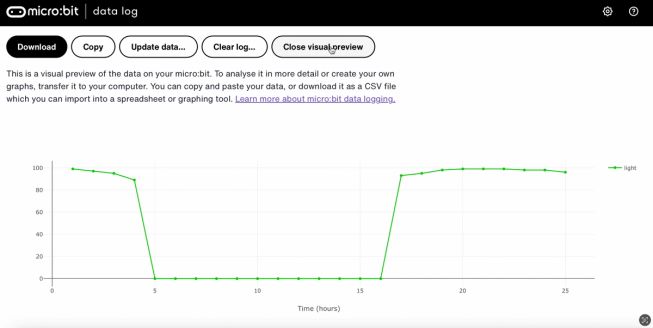
You can click on Copy and then paste your data into a spreadsheet. If you collect all your data into one spreadsheet, it is easier to compare information from the different sides of the building.
Step 4: Code it
Watch this video to find out how to code the project:
If you are interested in modifying the code for this project, click on the buttons below: