Step 1: Introduce it
First, watch the video
Visit BBC Teach to watch the playground survey activity video and download the complete teacher instructions.
How it works
- The micro:bit is not automatically programmed to be an activity tracker but with the help of a machine learning model, it can become one.
- We used movement data samples from children to train a machine learning model. It uses that data to recognise movements that often happen in the playground.
- The micro:bit uses its accelerometer to detect movement data. This data is then used by the model to estimate which activity is taking place.
What you need
- the hex file with the activity tracker program (includes the machine learning model)
- an alternative hex file is available if you have pupils in your class who use a wheelchair or have a mobility impairment (see BBC Teach instructions for how to use this)
- To put code on your micro:bit, and to view the MY_DATA file afterwards, you will need one of the following:
- a computer (e.g. laptop or Chromebook) and a micro:bit USB lead
- an Android tablet with the micro:bit USB lead and an adaptor (support article with more detail for Android tablets)
- an Apple iPad with Bluetooth enabled and the micro:bit app (support article with more detail for Apple iPads)
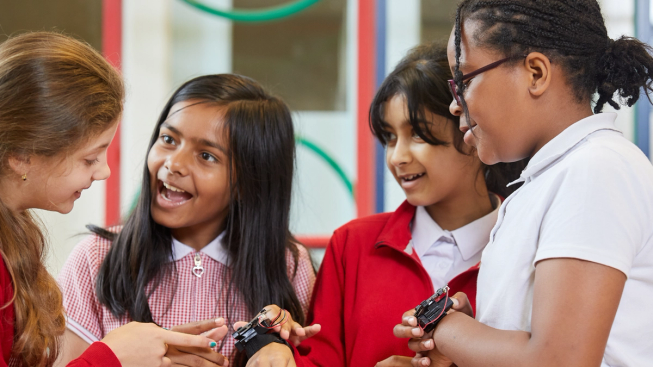
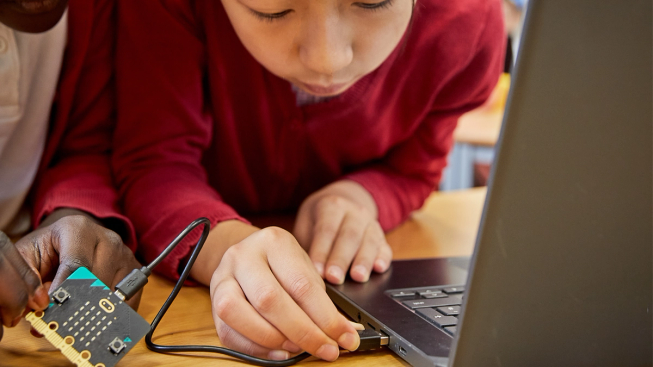
- micro:bit, battery pack, flexible micro:bit holder and wearable strap for each student (holders and straps are included in your BBC micro:bit - the next gen pack)
Step 2: Log data
Prepare it
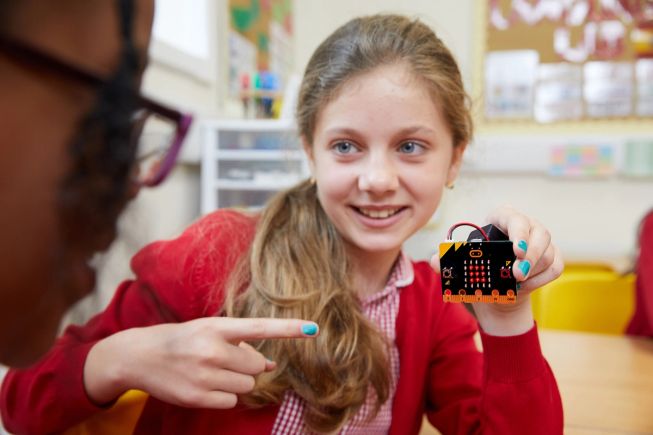
- This program will not open in MakeCode. You need to put the code on the micro:bit using the 'drag and drop' method.
- First download the activity tracker hex file (or the alternative movement level hex file).
- Then transfer the program onto the micro:bits, using the 'drag and drop' method.
- If this triggers a low battery animation on the micro:bit, then replace the batteries.
How to wear it
- Watch the video below to see how to assemble the flexible micro:bit holder, wearable strap, battery pack and micro:bit.
- Pupils can help each other attach the micro:bits to either wrist when using the activity tracker hex file.
- If using the movement level hex file, depending on the pupil's mobility, it may be more appropriate to mount the micro:bit on a different part of the body, on a walking aid or on the wheel of a wheelchair.
- The micro:bits can be taken off and/or powered off until break time/lunchtime.
Step 3: Use it
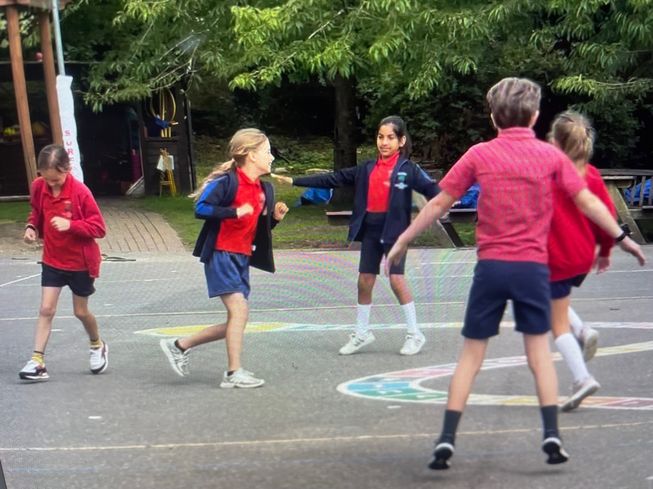
Log data in the playground
- This session plan suggests pupils log their movement data over a break time and a lunch time on the same day, but you could choose to investigate movement in the playground at other times.
- Pupils should start logging data as they leave the classroom and stop logging data when they re-enter the classroom at the end of break or lunch.
- Plug in battery packs, and attach micro:bits to wrists with the logo facing up.
- To start logging press buttons A and B together at the same time. A tick will appear on the display to show logging has started.
- Pupils should try to ignore the micro:bit and enjoy time in the playground as normal.
- They should continue to log movement while eating lunch, but they may stop/start logging when they enter/exit the school toilets.
- Make sure to stop logging once back in the classroom by pressing buttons A and B at the same time again.
- Make sure pupils know that a tick on the display means logging is on and a square means logging is off when using the activity tracker hex file (a heart means logging is off when using the movement level hex file).
- Make sure to repeat this process to log data for lunchtime.
Visit BBC Teach for the complete playground survey teacher instructions and use the checklist in the Fieldwork section to make sure everyone is ready.
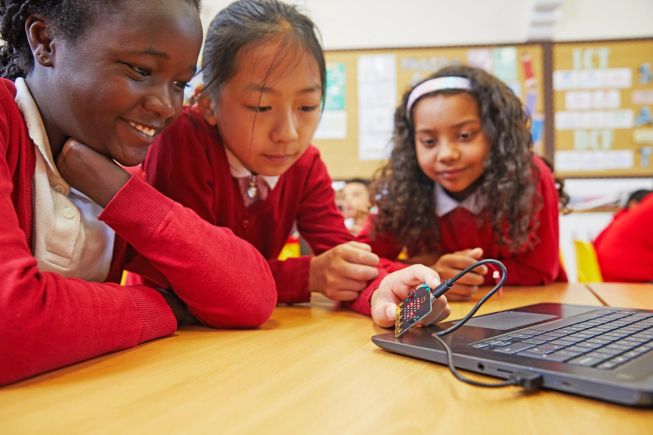
Step 4: View your data
Plug your micro:bit into a computer and follow the instructions to see your individual movement data on the micro:bit's MY_DATA file. Do not transfer any hex file onto the micro:bit as this will delete the data you have logged.
If you are using a tablet without a USB connection, the my_data file can be located using the micro:bit app.
Step 5: Analyse & rate the accuracy of your data
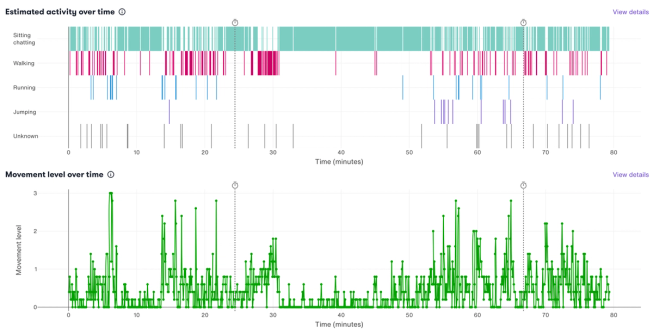
Take some time to interpret and compare the data on the different graphs:
- Estimated activity over time (data from the ML model)
- Movement level over time (data from the accelerometer)
- Total time spent doing estimated activities (from the ML model)
Use the teacher instructions to support analysing the data together in the classroom. You could ask the following questions:
Questions about our overall findings:
- How long were you in the playground logging movement?
- Does your data look different at different parts of the break/lunchtime?
- Does the graph reflect the different types of activity you did while you were in the playground?
Analysing estimated activity data from the ML model:
- What estimated activity did the micro:bit detect most/least?
Analysing movement level data from the accelerometer:
- Did your movement register at different movement levels?
- Which movement level did the micro:bit detect the most/least?
Link back to what we wanted to find out:
- What types of activities do we do in our school playground?
- How accurate is the data?
Rate the data accuracy through a class vote.
- Do the graphs match what you were really doing?
- Was your movement data extremely accurate / accurate / inaccurate or extremely inaccurate?
Looking ahead:
- What action do we want to take based on our findings?
If you want to explore how data samples impact the accuracy of machine learning models, the next activity, Exploring machine learning, takes you through this while creating your own model.
Using data in other lessons:
If you would like to use individual pupil data for lessons on data handling or statistics, you can export data as a table, or save images of the graphs. Click on View details to the right of each graph you want to download, then choose to download the image of the data, or download the data in a table (csv file) which can be opened in a spreadsheet. Bar charts can also be viewed as pie charts by changing chart type in the drop-down menu in the detailed view.
Downloading or copying the Movement level over time graph and annotating it with the exact activities pupils were doing while in the playground is an ideal way to evaluate the data. Pupils could paste the image into a document or slide and add notes.