Paso 1: Preparación
¿Qué es?
Usa tu BBC micro:bit para decidir dónde colocar un panel solar midiendo la luz en diferentes lados de un edificio.
Este proyecto ha sido desarrollado en colaboración con White Rose Science para profesores de Ciencias y permite a los estudiantes usar un registrador de datos, informar y presentar hallazgos de las investigaciones, y aprender más sobre las fuentes de energía renovables. Los estudiantes también pueden trabajar con variables y varias formas de entrada y salida en un programa informático.
Este video explica cómo hacer el experimento:
Cómo funciona
- Necesitarás cuatro micro:bits, cada una con el archivo HEX del registrador de datos de luz solar.
- Cada micro:bit se conecta a un portapilas y se guarda en una bolsa de plástico sellada.
- Una bolsa se adhiere a los lados norte, sur, este y oeste de un edificio, o a tantos lados como puedas acceder.
- Registrarás información sobre los niveles de luz en las cuatro micro:bits durante 24 horas.
- Descarga y compara los datos para descubrir la mejor ubicación para un panel solar.
Lo que necesitas
- micro:bits
- bolsas de plástico transparentes
- portapilas con pilas nuevas en ellos
- cadena
- ordenador/portátil/tablet y cable USB para permitir la visualización de los datos
Paso 2: Investigar
- Descarga el archivo HEX del registrador de datos de luz solar y cárgalo en tus micro:bits. En este proyecto, no necesitas escribir el código para realizar el experimento. Si te interesa programarlo, visita la sección Paso 4: prográmalo a continuación.
- Conecta tus portapilas y coloca cada micro:bit en una bolsa de plástico sellada para evitar que se mojen.
- Marca cada bolsa de plástico para que puedas identificar su ubicación al analizar los datos.
- Fija tus bolsas a los lados de tu edificio, asegurándote de que no haya nada proyectando una sombra sobre ellas.
- Presiona el botón A en cada micro:bit para iniciar el registro de datos. Cuando comiences a registrar, aparecerá una marca de verificación en la pantalla LED de la micro:bit durante dos segundos. Después de eso, un LED se encenderá en la esquina superior izquierda de la pantalla para mostrarte que la micro:bit está en modo de registro. También aparecerá un corazón en la pantalla una vez por hora mientras se registran los datos.
- Regresa después de 24 horas y presiona el botón B en cada micro:bit para detener el registro. Aparecerá una cruz en la pantalla LED de cada micro:bit.
Consejos
- Para mayor precisión, inclina cada micro:bit 45 grados desde una pared, usando una pequeña piedra como peso para mantenerla en su lugar.
- Si necesitas realizar el experimento de nuevo, elimina los datos presionando los botones A y B juntos. Aparecerá una calavera en la pantalla LED. Presiona el botón de reinicio en la parte posterior de la micro:bit para restablecer el tiempo a 0.
Paso 3: Análisis
Para ver los datos registrados, desconecta el paquete de baterías y conecta la micro:bit a un ordenador. El micro:bit aparece como una unidad USB llamada MICROBIT. Busca en la unidad MICROBIT y abre el archivo MY_DATA para ver una tabla de tus datos en un navegador web:
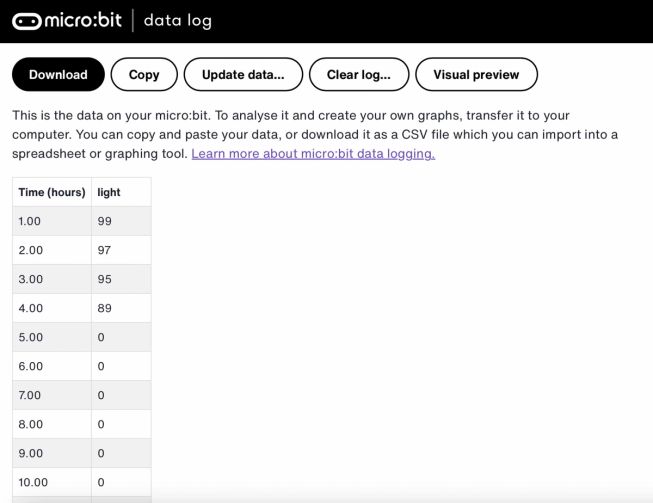
- Las marcas de tiempo en el registro representan la cantidad de tiempo que ha transcurrido desde que comenzó el registro de datos.
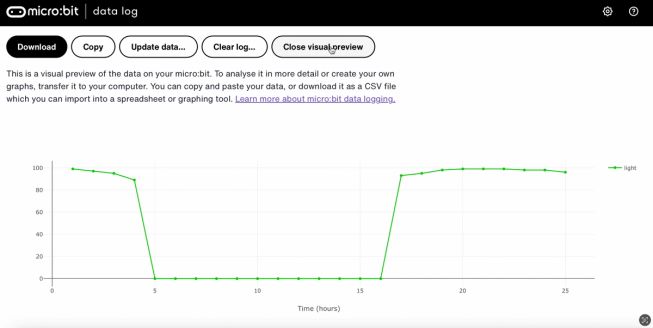
- Haz clic en Vista previa visual para ver un gráfico de tus datos:
Puedes hacer clic en Copiar y luego pegar tus datos en una hoja de cálculo. Si recopilas todos tus datos en una sola hoja de cálculo, es más fácil comparar la información de los diferentes lados del edificio.
Paso 4: Codifícalo
Mira este video para saber cómo codificar el proyecto:
Si estás interesado en modificar el código para este proyecto, pulsar en los botones a continuación: