Step 1: Prepare
What is it?
Use your BBC micro:bit to decide where to put a solar panel by measuring light on different sides of a building.
This project is developed in partnership with White Rose Science for science teachers and allows students to use a data logger, report and present findings from enquiries, and learn more about renewable energy sources. Students can also work with variables and various forms of input and output in a computer program.
This video explains how to do the experiment.
How it works
- You will need four micro:bits, each with the sunlight data logger hex file on.
- Each micro:bit is attached to a battery pack and put into a sealed plastic bag.
- One bag is attached to the north, south, east, and west sides of a building, or as many sides as you can access.
- You log information about light levels on all four micro:bits for 24 hours.
- Download and compare the data to discover the best placement for a solar panel.
What you need
- micro:bits
- clear plastic bags
- battery packs with new batteries in them
- string
- a computer/laptop/tablet and USB cable to enable you to view data
Step 2: Investigate
- Download the sunlight data logger hex file and put it on your micro:bits. You do not need to write the code for this project yourself to do the experiment. If you are interested in coding it, visit the Step 4: Code it section below.
- Attach your battery packs and put each micro:bit into a sealed plastic bag to prevent them from getting wet.
- Mark each plastic bag so you can identify its location when analysing the data.
- Fix your bags to the sides of your building, ensuring there is nothing casting a shadow over the bags.
- Press button A on each micro:bit to start data logging. When you start logging, a tick appears on the micro:bit’s LED display for two seconds. Following that, one LED lights up in the top-left corner of the display to show you that the micro:bit is in logging mode. A heart also appears on the display once per hour when data is being logged.
- Return after 24 hours and press button B on each micro:bit to stop logging. A cross appears on each micro:bit’s LED display.
Tips
- To be more accurate, angle each micro:bit at 45 degrees from a wall, using a small stone as a weight to keep it in place.
- If you need to conduct the experiment again, delete the data by pressing buttons A and B together. A skull will appear on the LED display. Press the reset button on the back of the micro:bit to set the time back to 0.
Step 3: Analyse
To look at the data logged, disconnect the battery pack and plug the micro:bit into a computer. The micro:bit appears like a USB drive called MICROBIT. Look in the MICROBIT drive and open the MY_DATA file to see a table of your data in a web browser:
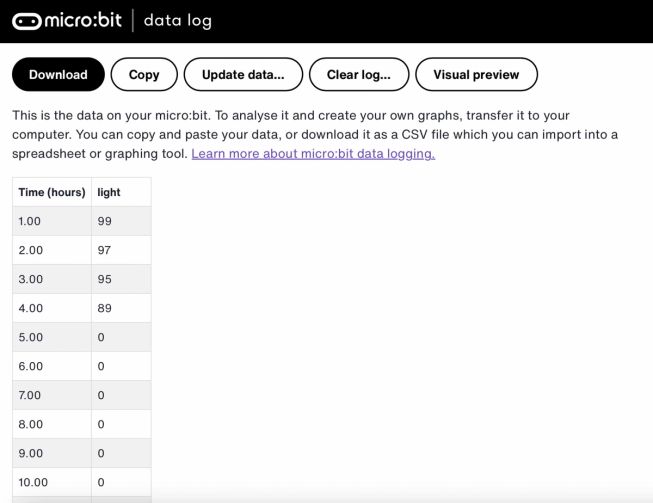
- The time stamps in the log represent the amount of time that has passed since data logging began.
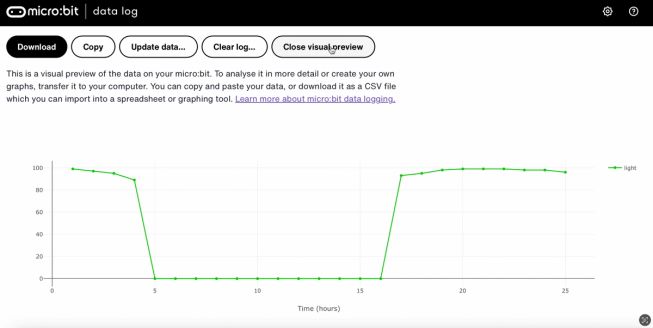
- Click on Visual preview to see a graph of your data:
You can click on Copy and then paste your data into a spreadsheet. If you collect all your data into one spreadsheet, it is easier to compare information from the different sides of the building.
Step 4: Code it
Watch this video to find out how to code the project:
If you are interested in modifying the code for this project, click on the buttons below: