Step 1: Prepare
What is it?
Use your BBC micro:bit to investigate which material is the best thermal insulator.
This project is developed in partnership with White Rose Science for science teachers and allows students to compare everyday materials based on their properties. Students can also learn about data logging and using simple loops, sequences, and variables in computer programs.
This video explains how the project works and how to do the experiment.
How it works
- This experiment requires two different programs on two micro:bits: sensor and display programs.
- The sensor micro:bit works as a data logger and logs its own temperature. It also sends its temperature readings to the display micro:bit every minute by radio.
- The display micro:bit displays the temperature of the sensor micro:bit.
- You wrap the sensor micro:bit in an insulating material that you want to test and place it in the fridge.
- When the sensor micro:bit is cold enough, you remove it from the fridge and begin data logging, or take readings manually, to see how quickly it warms up.
What you need
- pieces of material to test such as felt, bubble wrap, or cling film
- two micro:bits
- at least one battery pack
- sticky tape or paper clips to hold the wrapped material on the micro:bit
- access to a fridge
- a stopwatch or timer
- a computer/laptop/tablet and USB cable to enable you to view data
Step 2: Investigate
- Download the hex files and put the code onto your micro:bits, once you have read point 2 below. You do not need to write the code for this project yourself to do the experiment, but if you are interested in coding it, visit the Step 4: Code it section below.
- If you are doing this experiment in a class or coding club, each pair of micro:bits should have different radio group numbers. This will ensure the display micro:bit receives the readings from the correct sensor micro:bit. Open the project in Microsoft MakeCode and enter a unique number in the radio set group block, then download the code onto two micro:bits. Keep them together with an elastic band or in a small bag. Repeat for each pair of micro:bits.
- Attach a battery pack to the sensor micro:bit.
- Wrap the sensor micro:bit in the material you want to test and put it on a plate in the fridge for an hour. To ensure a fair test when comparing different materials, always use the same number of layers.
- Remove the sensor micro:bit from the fridge when it reaches the same starting temperature each time you conduct the experiment. Press button B on the display micro:bit to find out the temperature of the sensor micro:bit. You can probably do this with the fridge door shut if you are close enough to the fridge!
- Take out the sensor micro:bit if it is cold enough. Remove it from the fridge by holding the plate, as your hands could warm it up.
- Begin data logging by pressing button A on the sensor micro:bit.
- Now, using a stopwatch or timer to ensure accuracy, take manual readings of the temperature of the sensor micro:bit every minute by pressing button B on the display micro:bit.
- Finish the experiment after ten minutes by pressing button B on the sensor micro:bit to stop data logging.
Tips
- You may wish to run an experiment on a micro:bit that has not been wrapped in a material, to act as a control. You can then compare those results to results from micro:bits that have been wrapped in different materials.
- This experiment does not work well with silver foil, as it can block the micro:bit’s radio signals or even damage it.
- micro:bits warm up quickly when you take them out of the fridge. Conduct the experiment in your school kitchen, or move them to your classroom in a cool bag or box.
- If you need to conduct the experiment for a second time using the same pair of micro:bits, delete the data from the sensor micro:bit by pressing buttons A and B together. You should also press the reset button on the back of the micro:bit to set the time in minutes back to 0.
Step 3: Analyse
To look at the data logged, disconnect the battery pack and plug the sensor micro:bit back into a computer. The micro:bit appears like a USB drive called MICROBIT. Look in the MICROBIT drive and open the MY_DATA file to see a table of your data in a web browser:
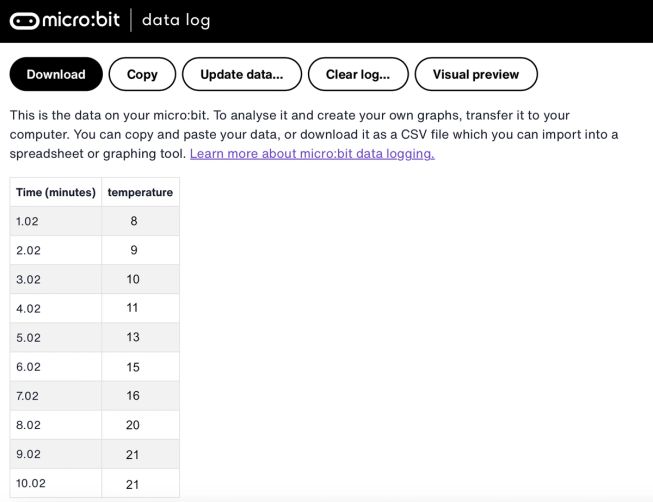
- The time stamps in the log represent the amount of time that has passed since data logging began.
- Click on Visual preview to see a graph of your data:
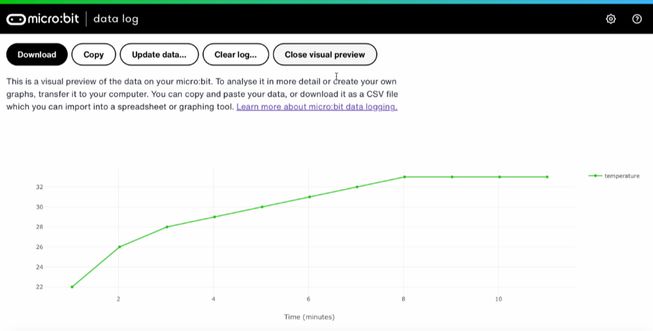
- You can also click on the Copy button and then paste your data into a spreadsheet.
- You might like to compare the data you have collected manually with the micro:bit’s log to decide which is more accurate.
Step 4: Code it
Watch this video to find out how to code the project:
If you are interested in modifying the code for this project, click on the buttons below: